CHAPTER THREE
An Experimental Investigation of the Effects of Logging on Success of Acadian Flycatcher (Empidonax virescens) Nests in Yellowwood State Forest, Indiana
ABSTRACT
Habitat edges may elevate both predation of avian nests and brood parasitism by Brown-headed Cowbirds (Molothrus ater). Cutting individual and small groups of trees for timber generates high edge density. Some evidence indicates logging reduces nest success, but few studies have measured success before and after timber extraction. I designed an experiment to evaluate the effects of logging in Yellowwood State Forest, a deciduous forest in south-central Indiana. I measured survival and parasitism of Acadian Flycatcher (Empidonax virescens) nests in 8 tracts in Yellowwood in 1995 and 1996. Four tracts were logged between these two breeding seasons, using individual and group selection techniques. Four other sites were controls.
In 1995, nest predation was higher for nests initiated during the period of peak nest abundance than for later nests. Daily survival rate (DSR) during the egg stage was higher at treatment sites than at control sites in 1995. Nestling-stage DSR was low at both sets of sites in that year. In 1996, egg-stage DSR was high at both sets of sites. Nestling-stage DSR was lower at sites that were logged than at control sites. Overall success rate of nests increased from 1995 to 1996 at control sites, but was similar at treatment sites before and after logging. Cowbird parasitism decreased from 1995 to 1996 at control sites, but was similar at treatment sites before and after logging.
If factors responsible for between-year variation operate similarly in both sets of sites, the observed interactions between year and condition (treatment or control) may indicate logging decreases breeding success. Alternatively, site-specific processes at control tracts may have caused higher success in 1996. Public forest managers should limit logging where productivity of late-successional migrant birds is a priority until we better understand the factors influencing spatio-temporal variation in nesting success. Longer-term studies, with measurements for several years before and after logging, are necessary to understand how timber extraction affects avian breeding success. It is especially important to investigate how management practices affect the abundance, habitat selection, and breeding success of avian species restricted to regenerating forest habitat.
INTRODUCTION
Habitat edges may reduce avian breeding success by reducing pairing success of males (Ortega and Capen, 1999; Burke and Nol, 1998; Van Horn et al., 1995), increasing levels of nest predation by various predators (e.g., Bourque and Villard, 2001; Flaspohler et al., 2001a; Flaspohler et al., 2001b; Ford et al., 2001; Huhta and Jokimaki, 2001; Fenske-Crawford and Niemi, 1997; Paton, 1994; Wilcove, 1985; Brittingham and Temple, 1983; Chasko and Gates, 1982; Whitcomb et al., 1981; Gates and Gysel, 1978), increasing levels of brood parasitism by Brown-headed Cowbirds (Molothrus ater, e.g., Ford et al., 2001; Winslow et al., 2000; Brittingham and Temple, 1983; Chasko and Gates, 1982; Gates and Gysel, 1978), and by decreasing food availability (Burke and Nol 1998). Nest predators in forests of the Midwestern United States include Blue Jays (Cyanocitta cristata), rat snakes (Elaphe obsoleta), and raccoons (Procyon lotor).
Some evidence indicates logging reduces nest success (Robinson and Robinson, 2001; Bourque and Villard, 2001; Flaspohler et al., 2001a; Flaspohler et al., 2001b; Huhta and Jokimaki, 2001; Winslow et al., 2000; Morse and Robinson, 1999; Fenske-Crawford and Niemi, 1997), but few studies have measured success before and after timber extraction. Furthermore, some researchers have failed to find negative effects of logging on breeding success (e.g. Duguay et al., 2001).
A. Variation in Nesting Success over the Course of a Season
There exists substantial variation in nest survival and cowbird parasitism over various scales of space and time. It is difficult to assign a portion of this variation to the effects of forest management activities without examining all the sources of variation. Nest success and brood parasitism can be quite different among sites or among years at the same site. One of the most significant sources of variation may be variation over time within the course of a given field season. In temperate forests nest density varies greatly over the course of a breeding season, increasing quickly at the beginning and peaking before the middle of the season. Predation levels in some systems are high early in the season but much lower late in the season (Wilson and Cooper, 1998; Nolan, 1978; Gottfried and Thompson, 1978). Within-season variation is important to study because it constitutes a large portion of the existing variation, it provides a baseline to evaluate the effects of logging and other forms of vegetative disturbance, and it is essential to consider when estimating seasonal fecundity. Late-season nesting, and the ability of birds to raise multiple broods, are especially important in this regard.
B. History of Nest Survival Analysis
Ornithologists who measure nesting success typically monitor every nest that is discovered and can be easily monitored. For this reason samples are never random and are subject to many potential biases. Mayfield (1961, 1975) introduced a method to estimate nesting success while correcting for one such bias. Because successful nests are active for longer than unsuccessful nests, they are more likely to be discovered by researchers and tend to be over-represented in samples. Success rate calculated as proportion of nests that are successful will overestimate the true success rate.
The Mayfield method corrects for this bias by calculating daily nest survival based on the length of time that nests are monitored. One records the number of days each nest is active and known to researchers ("exposure-days") during each nest stage (i.e. laying, incubation, and nestling) and the number of nests lost in each stage. One calculates daily survival rate (DSR) as the proportion of exposure days (for all nests in the sample summed) on which a nest survived (i.e. DSR = 1 - losses/exposure). This statistic is the maximum likelihood estimator of the probability a nest will survive a given day (Hensler and Nichols, 1981). Raising the DSR calculated for a given nest stage to the power of the number of days necessary to complete that stage yields an estimate of the probability that a given nest will survive that stage. Overall success rate (i.e. the probability a given nest will survive from clutch initiation to fledging) can then be estimated as the product of the estimated probabilities of success for all stages.
Because DSR is the proportion of days in which a nest survived, many researchers treat nest survival statistics as frequency data, where the exposure-day is the sampling unit. Some investigators have used a contingency table approach (e.g. Holmes et al. 1992). Hensler and Nichols (1981) devised a Z-test to compare nest survival rates and used simulations to show that this method performed well with samples of 20 nests.
Sauer and Williams (1989) introduced a procedure to contrast survival rates based on recapture and recovery data. This procedure was widely adopted by researchers studying nest success after Hines and Sauer (1989) developed a software program named CONTRAST to perform the necessary calculations. The input parameters for the program are survival rate and standard error. Because users must calculate standard errors before running CONTRAST, it is not clear that this method is easier to use for nesting studies than statistical packages that perform contingency table analysis. Perhaps the appeal among students of nest success is the ability to test multiple hypotheses through planned contrasts.
There seem to be a number of weaknesses to the approach of treating exposure days as frequency data. Because the exposure-day is considered the sampling unit, days from the same nest are not independent. This may thus be considered a type of pseudo-replication. Furthermore, the time interval seems arbitrary--one could just as easily consider hours or minutes to be sampling units.
For these reasons my colleagues and I have chosen to use resampling analysis to compare nest survival rates (Ford et al. 2001). The general approach is to pool nests from all samples, with associated exposure and loss data, and randomly draw nests with replacement from the total data set to produce 10,000 (or so) simulated data sets. Next one calculates the parameter of interest from each simulated data set and compares the observed parameter to the distribution of simulated parameters to determine the probability that a value as or more extreme as the observed value would be drawn from the simulated distribution.
The advantages of a resampling approach are that the nest is the sampling unit, it is easy for the investigator to understand what the results show, it is possible to perform a test on any parameter that can be calculated, there is a minimal set of assumptions, and it is possible to examine interaction effects.
We first presented this resampling approach in
an analysis of the effects of an agricultural corridor on nest survival (Ford
et al. 2001). In that study we calculated Mayfield statistics for
seven breeding bird species, pooled among years. For each species, we pooled
data for two sites (a site adjacent to an agricultural corridor and an interior
forest site) to generate 10,000 simulated data sets. We did this separately
for the egg (laying plus incubation) and nestling stages. For each simulated
data set, we calculated the difference in DSR between the two sites. We
then compared the observed difference in DSR to the distribution of simulated
differences. In this chapter I employ a similar approach, although the parameters
examined sometimes differ.
C. Objectives
I designed an experiment to evaluate the effects of logging in Yellowwood State Forest, a deciduous forest in south-central Indiana, on nest survival and cowbird parasitism level. State foresters mark timber in Indiana state forests using individual and group selection techniques. Private logging contractors remove individually marked trees from within a harvest tract, and typically create several small "regeneration openings" where foresters have demarcated groups of trees. Site preparation, entailing the construction and maintenance of roads, skid trails, and log landings, results in additional disturbance. These methods generate high edge density and may thus increase the abundance and/or activity of nest predators and cowbirds.
For this reason one might hypothesize that the extraction of timber from state forests decreases avian nest survival (by increasing predation) and increases cowbird parasitism. In this chapter I test the following predictions of this hypothesis: (1) nest survival is lower in forest sites that have recently been logged than in similar tracts that have not been logged, (2) cowbird parasitism is higher in forest sites that have recently been logged than in similar tracts that have not been logged, (3) birds breeding in forest tracts that have recently been logged experience lower nest survival after harvest than before harvest, and (4) birds breeding in forest tracts that have recently been logged experience higher cowbird parasitism after harvest than before harvest.
METHODS
A. Field Methods
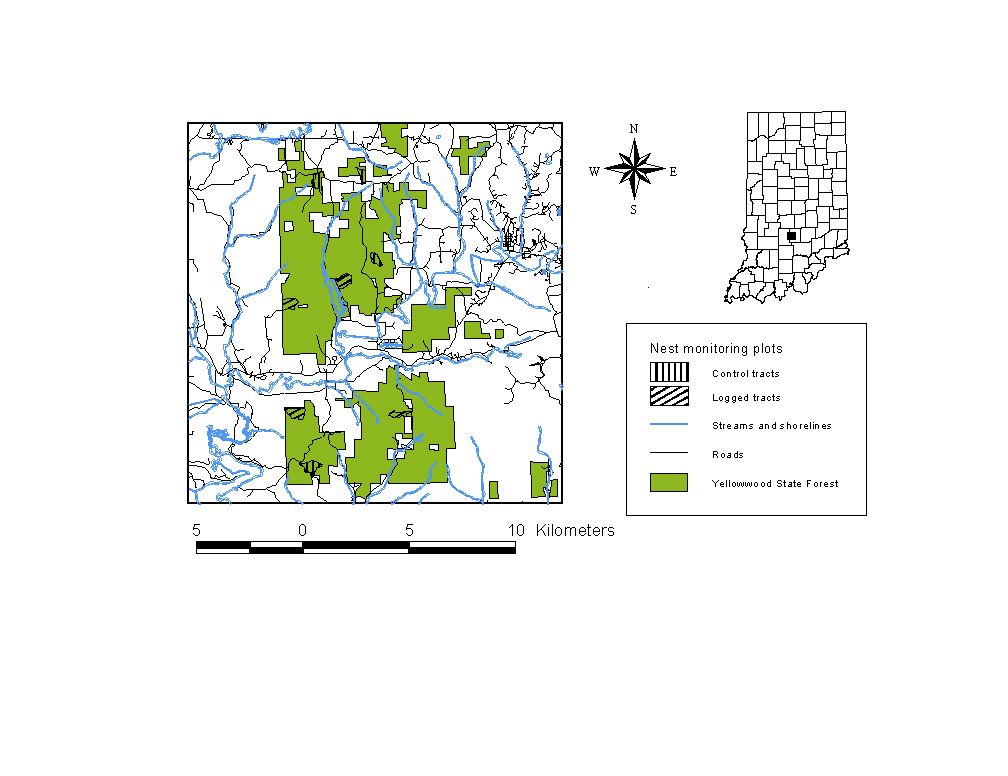
I employed a crew of field assistants to measure survival and parasitism of Acadian Flycatcher (Empidonax virescens) nests in 8 tracts in Yellowwood in 1995 and 1996 (Table 3.1, Figure 3.1). Logging contractors extracted timber from four tracts between these two breeding seasons, cutting trees that state foresters had marked using individual and group selection techniques. Four other sites were controls. We attempted to locate all Acadian Flycatcher nests within these tracts, and also monitored nests of other species. We examined the contents of each nest every third day, using mirrors mounted on extendable poles.
Table 3.1: Eight tracts in Yellowwood State Forest that were monitored in 1995 and 1996. Timber was extracted from Treatment sites between the two breeding seasons; Control sites remained unlogged.
| Site name | Site code | Compartment | Tract | Condition |
| Dubois Ridge | DU | 6 | 3 | Control |
| Lanam Ridge | LR | 8 | 1 | Control |
| Shaw's Hollow | SH | 1 | 16 | Control |
| White Ridge | WR | 10 | 10 | Control |
| Ferris West | EX | 1 | 1 | Treatment |
| Mossop Ridge | MR | 2 | 15 | Treatment |
| Scarce'o'fat | SF | 9 | 10 | Treatment |
| Yellowwood Lake | YL | 7 | 20 | Treatment |
We attempted to determine the fate of each nest, and how many host and/or cowbird young fledged.
Figure 3.1: Map of nest monitoring plots in Yellowwood State Forest. See Table 3.1 for site codes.
I included nests known to be active and low enough to be monitored with a mirror for analysis. I excluded nests whose fates were clearly affected by observers. I attempted to assign fates to all other nests, although the fates of some nests were uncertain. I pooled nests among all four sites within each condition (treatment and control).
B. Analysis of Variation in Predation within a SeasonI examined variation in nest abundance and nest predation over the course of one field season (1995) in order to evaluate the importance of within-season variation in the absence of logging, and to understand the relationship between nest abundance and predation level. I evaluated the hypothesis that predation is higher during peak nesting than later in the season by testing the prediction that daily predation rate is higher for early Acadian Flycatcher nests than for later nests of that species.
I performed a bootstrap resampling technique to test this prediction, using the RESAMPLING STATS software package (Version 5.03; Arlington, Virginia). I drew nests randomly with replacement from the 1995 data set to generate 10,000 simulated samples of early and late nests, calculated the difference in daily predation rate for each pair of simulated samples to generate a distribution of differences, and compared the observed difference in daily predation rate with confidence bounds of the simulated distribution.
C. Analysis of Effects of Logging on Nest SurvivalIn order to understand the effects of timber extraction on nest survival, I resampled nest survival data calculating three different odds ratios; (1) the ratio of overall success rate (OSR) of Acadian Flycatcher nests from 1996 to OSR for 1995 for all sites pooled, (2) the ratio of OSR from cut sites to OSR from uncut sites for both years pooled, and (3) the ratio of the cut-to-uncut ratio for 1996 to the cut-to-uncut ratio for 1995. The extent to which this last odds ratio deviates from one indicates the magnitude of the interaction between year and treatment, and thus the effect of timber extraction.
In order to perform the resampling analysis to evaluate the interaction effect, I generated 10,000 simulated data sets with samples for each combination of year and treatment. For each simulated data set, I calculated the odds ratio of OSR in cut sites to uncut sites for both years. I then calculated (for each simulated data set) the ratio of the odds ratio for 1996 to the odds ratio for 1995 and compared the observed ratio of ratios to the distribution of simulated ratios of ratios.
D. Analysis of Effects of Logging on Brood ParasitismIn order to examine the effect of timber extraction on cowbird parasitism I employed contingency table analysis, with year and treatment as independent variables and proportion of parasitized Acadian Flycatcher nests as the dependent variable (SYSTAT, 1992). I compared log-likelihood ratio statistics (G) to critical values of the c2 distribution. The extent to which the three-way interaction varies from values expected assuming independence indicates the magnitude of the effect of logging.
RESULTS
A. Variation in Nesting Success over the Course of a Season
In 1995 we monitored nests of 19 species. Reproductive statistics for these species are shown in Table 3.2.
Table 3.2: Reproductive statistics for nests of 19 species monitored in Yellowwood State Forest (all sites combined) during 1995. Length of exposure (when nests were active and being monitored) summed for all nests is shown for the egg and nestling stages. Daily survival rate (DSR) is calculated as 1 - losses/exposure.
| Number | Proportion | Egg Stage | Nestling Stage | Proportion | |||
| Species | of nests | fledged | Exposure (days) | DSR | Exposure (days) | DSR | parasitized |
| Yellow-billed Cuckoo (Coccyzus americanus) | 1 | 0.00 | 4.5 | 0.78 | 0 | 1.00 | 0.00 |
| Whip-poor-will (Caprimulgis vociferus) | 1 | 0.00 | 8.5 | 0.88 | 0 | 1.00 | 0.00 |
| Ruby-throated Hummingbird (Archilochus colubris) | 2 | 0.00 | 10.5 | 0.81 | 0 | 1.00 | 0.00 |
| Acadian Flycatcher (Empidonax virescens) | 135 | 0.36 | 1541 | 0.97 | 812.5 | 0.95 | 0.11 |
| White-eyed Vireo (Vireo griseus) | 1 | 0.00 | 9.5 | 0.89 | 0 | 1.00 | 0.00 |
| Blue-headed Vireo (Vireo solitarius) | 1 | 0.00 | 12.5 | 0.92 | 0 | 1.00 | 0.00 |
| Red-eyed Vireo (Vireo olivaceus) | 21 | 0.24 | 167.5 | 0.96 | 81 | 0.88 | 0.57 |
| Carolina Chickadee (Poecile carolinensis) | 2 | 1.00 | 0 | 1.00 | 15 | 1.00 | 0.00 |
| Wood Thrush (Hylocichla mustelina) | 24 | 0.38 | 169 | 0.94 | 132 | 0.96 | 0.25 |
| Gray Catbird (Dumetella carolinensis) | 2 | 0.50 | 9.5 | 1.00 | 12.5 | 0.92 | 0.00 |
| Worm-eating Warbler (Helmitheros vermivorus) | 26 | 0.81 | 134 | 0.99 | 141.5 | 0.97 | 0.46 |
| Ovenbird (Seiurus aurocapillus) | 13 | 0.46 | 67 | 0.94 | 44.5 | 0.93 | 0.46 |
| Louisiana Waterthrush (Seiurus motacilla) | 4 | 0.50 | 19.5 | 0.95 | 13.5 | 0.93 | 0.25 |
| Kentucky Warbler (Oporornis formosus) | 2 | 1.00 | 0 | 1.00 | 2 | 1.00 | 0.00 |
| Hooded Warbler (Wilsonia citrina) | 19 | 0.53 | 101.5 | 0.95 | 81 | 0.95 | 0.47 |
| Scarlet Tanager (Piranga olivacea) | 1 | 1.00 | 9 | 1.00 | 11.5 | 1.00 | 1.00 |
| Eastern Towhee (Pipilo erythrophthalmus) | 2 | 0.50 | 21.5 | 1.00 | 16 | 0.94 | 0.00 |
| Northern Cardinal (Cardinalis cardinalis) | 8 | 0.63 | 45 | 1.00 | 46 | 0.93 | 0.00 |
| Indigo Bunting (Passerina cyanea) | 6 | 0.33 | 49.5 | 0.94 | 24.5 | 0.96 | 0.17 |
Predation levels tended to be higher during peak nesting than later in the season when nest abundance was lower. To demonstrate this I used the number of monitorable nests of all species known to be active each day among all sites during 1995 as an index of nest abundance. I plotted this index of nest abundance over the course of the season (Figure 3.2). Figure 3.2 also shows the proportion of nests depredated each day during the season. The peak in nest predation occurred a week or two after the peak in nest abundance (Figure 3.2). (High values of predation toward the end of the season reflect variability resulting from low sample sizes.)
Figure 3.2. Number of nests known to be active and monitorable
each day in 1995 in eight tracts in Yellowwood State Forest, pooling all
species. Also shown are the percentage of nests taken by predators
on each day. Early and late portions of the season are divided by 19
June, which is the date when nest abundance stabilized after the period of
peak nesting.
The number of Acadian Flycatcher nests known to be active each day followed a similar pattern over the season as that for all species pooled, though beginning later in the season and with more pronounced bimodality (Figure 3.3). Proportion of Acadian Flycatcher nests preyed upon showed peaks a week or two after the peaks in flycatcher nest abundance (Figure 3.3). I classified flycatcher nests into early (clutch initiated before 19 June) and late (clutch initiated after 18 June) nests. Daily predation rate was higher for early nests than for late nests (Table 3.3). Bootstrap analysis showed that this difference was statistically significant during the nestling stage, but not during the egg stage (Table 3.3).
Table 3.3: Daily predation rate of Acadian Flycatcher nests in 1995 in eight tracts in Yellowwood State Forest in the egg and nestling stages. Early clutches were initiated before 19 June and late clutches were initiated after 18 June. The difference in daily predation rate between early and late nests was outside bootstrap confidence bounds for the nestling stage but not for the egg stage.
|
|
Egg Stage | Nestling Stage | ||
| Early Nests | Late Nests | Early Nests | Late Nests | |
| Number of nests | 81 | 51 | 50 | 42 |
| Exposure (days) | 992.5 | 548.5 | 368 | 444.5 |
| Predations | 28 | 10 | 30 | 12 |
| Daily Predation Rate | 0.0282 | 0.0182 | 0.0815 | 0.0270 |
| Difference | 0.0100 | 0.0545 | ||
| Bootstrap Confidence Bounds | ||||
| 97.50% | 0.0151 | 0.0331 | ||
| 95% | 0.0125 | 0.0274 | ||
| 90% | 0.0098 | 0.0213 | ||
In 1995, daily survival rate (DSR) of nests during the egg stage was higher at treatment sites than at control sites (Table 3.4, Figure 3.4a). Nestling-stage DSR was low at both sets of sites in that year (Table 3.4, Figure 3.4b). In 1996, egg-stage DSR was high at both sets of sites (Table 3.4, Figure 3.4a). Nestling-stage DSR was lower at sites that were logged than at control sites (Table 3.4, Figure 3.4b) in 1996. Daily survival rate in treatment sites was similar before and after logging (Figure 3.4a, 3.4b).
Overall success rate of nests increased from 1995 to 1996 at control sites, but was similar at treatment sites before and after logging (Table 3.5, Figure 3.5). Resampling analysis indicated a statistically significant interaction between year and treatment (Table 3.6).
C. Effects of Timber Extraction on Cowbird ParasitismTable 3.7 presents cowbird parasitism data for the eight tracts monitored in Yellowwood in 1995 and 1996. Cowbird parasitism decreased from 1995 to 1996 at control sites, but was similar at treatment sites before and after logging (Figure 3.6). Although parasitism was similar at treatment and control sites in 1996, loglinear analysis shows a statistically significant interaction between year and condition (G = 3.49, df = 1, one-sided p = 0.031).
Table 3.4: Survival rate of Acadian Flycatcher nests in Yellowwood State Forest. Timber was cut in four sites between 1995 and 1996; the other four sites remained unlogged. Length of exposure (when nests were active and being monitored) summed for all nests is shown for the egg and nestling stages. Number of nests lost is also shown. Daily survival rate (DSR) is calculated as 1 - losses/exposure. Overall success rate (OSR) is calculated as DSR(egg)16*DSR(nestling)13.
| Before | logging | (1995) | After | logging | (1996) | |||||||||||
| Site | No. of | Exposure | Losses | DSR | Exposure | Losses | DSR | OSR | No. of | Exposure | Losses | DSR | Exposure | Losses | DSR | OSR |
| nests | days (egg) | (egg) | (egg ) | (nestling) | (nestling) | (nestling) | nests | days (egg) | (egg) | (egg ) | (nestling) | (nestling) | (nestling) | |||
| Unlogged | ||||||||||||||||
| DU | 11 | 123.5 | 5 | 0.960 | 42.5 | 4 | 0.906 | 0.143 | 8 | 75 | 3 | 0.960 | 42.5 | 1 | 0.976 | 0.382 |
| LR | 9 | 96.5 | 3 | 0.969 | 59.5 | 1 | 0.983 | 0.484 | 11 | 83.5 | 5 | 0.940 | 53 | 2 | 0.962 | 0.226 |
| SH | 36 | 462.5 | 11 | 0.976 | 235.5 | 12 | 0.949 | 0.345 | 36 | 511.5 | 3 | 0.994 | 370.5 | 6 | 0.984 | 0.736 |
| WR | 13 | 69.5 | 9 | 0.871 | 30 | 1 | 0.967 | 0.070 | 3 | 38 | 1 | 0.974 | 14 | 1 | 0.929 | 0.249 |
| Subtotal | 69 | 752 | 28 | 0.963 | 367.5 | 18 | 0.951 | 0.284 | 58 | 708 | 12 | 0.983 | 480 | 10 | 0.979 | 0.579 |
| Logged | ||||||||||||||||
| EX | 13 | 183.5 | 4 | 0.978 | 71 | 4 | 0.944 | 0.331 | 18 | 178.5 | 6 | 0.966 | 65 | 8 | 0.877 | 0.105 |
| MR | 10 | 120.5 | 4 | 0.967 | 59.5 | 2 | 0.966 | 0.374 | 15 | 174 | 1 | 0.994 | 126.5 | 4 | 0.968 | 0.601 |
| SF | 17 | 195.5 | 1 | 0.995 | 133 | 8 | 0.940 | 0.411 | 22 | 271.5 | 4 | 0.985 | 154 | 8 | 0.948 | 0.394 |
| YL | 26 | 289.5 | 6 | 0.979 | 181.5 | 11 | 0.939 | 0.317 | 24 | 265.5 | 8 | 0.970 | 120.25 | 7 | 0.942 | 0.281 |
| Subtotal | 66 | 789 | 15 | 0.981 | 445 | 25 | 0.944 | 0.347 | 79 | 889.5 | 19 | 0.979 | 465.75 | 27 | 0.942 | 0.326 |
| Total | 135 | 1541 | 43 | 0.972 | 812.5 | 43 | 0.947 | 0.314 | 137 | 1597.5 | 31 | 0.981 | 945.75 | 37 | 0.961 | 0.435 |
Table 3.5: Overall success rate of Acadian Flycatcher nests in eight tracts in Yellowwood State Forest. Timber was extracted from treatment tracts between the 1995 and 1996 breeding seasons.
| 1995 | 1996 | Pooled | |
| Control | 0.284 | 0.579 | 0.414 |
| Treatment | 0.347 | 0.326 | 0.336 |
| Pooled | 0.314 | 0.435 | 0.373 |
Table 3.6: Resampling analysis of overall success rate of Acadian
Flycatcher nests in Yellowwood State Forest. Alpha levels are shown for
the main effect of year, the main effect of condition (treatment or control),
and the interaction between year and treatment. Alpha levels were determined
by comparing observed odds ratios to confidence limits of bootstrapped values
(see text).
| Comparison | Alpha (two-sided) |
| 1996 to 1995 | 0.05 < p < 0.10 |
| Treatment to Control | p > 0.20 |
| Interaction | p < 0.05 |
DISCUSSION
If factors responsible for between-year variation operate similarly in both sets of sites, the observed interactions between year and treatment may indicate logging decreases breeding success. Alternatively, site-specific processes at control tracts may have caused higher success in 1996. For instance, the site with the largest sample of Acadian Flycatcher nests, Shaw's Hollow, was a control site. However, this site experienced much lower nest survival in 1995 than in 1996. Overall success rate of Acadian Flycatcher nests at this site in 1994 was 0.316, similar to the value estimated in 1995 (Table 3.4). It is unknown why success was so much higher at this site in 1996 than during the first two years, but the large sample of nests monitored at this site heavily influenced the overall pattern. If we exclude data from Shaw's Hollow, OSR at the other control sites was similar between 1995 (0.207) and 1996 (0.239).
Table 3.7: Cowbird parasitism data for Acadian Flycatcher nests in eight tracts in Yellowwood. Four tracts ("T") were logged between the 1995 and 1996 breeding seasons. Four other sites ("C") remained unlogged. Cowbird eggs per nest is calculated using all nests (parasitized and unparasitized) found before hatch.
| Pre-logging (1995) | Post-logging (1996) | |||||||
| Site | Number | Proportion | Nests found | Cowbird eggs | Number | Proportion | Nests found | Cowbird eggs |
| of nests | Parasitized | before hatch | per nest | of nests | Parasitized | before hatch | per nest | |
|
C |
||||||||
| DU | 10 | 0.000 | 10 | 0.000 | 8 | 0.125 | 7 | 0.143 |
| LR | 9 | 0.444 | 8 | 0.500 | 10 | 0.000 | 9 | 0.000 |
| SH | 31 | 0.065 | 31 | 0.065 | 34 | 0.059 | 34 | 0.059 |
| WR | 12 | 0.417 | 12 | 0.667 | 3 | 0.000 | 3 | 0.000 |
| 62 | 0.177 | 61 | 0.230 | 55 | 0.055 | 53 | 0.057 | |
| T | ||||||||
| EX | 13 | 0.154 | 13 | 0.154 | 17 | 0.235 | 16 | 0.250 |
| MR | 10 | 0.000 | 10 | 0.000 | 12 | 0.083 | 10 | 0.100 |
| SF | 16 | 0.125 | 16 | 0.125 | 18 | 0.056 | 17 | 0.059 |
| YL | 25 | 0.000 | 23 | 0.000 | 19 | 0.000 | 18 | 0.000 |
| 64 | 0.063 | 62 | 0.065 | 66 | 0.091 | 61 | 0.098 | |
| Total | 126 | 0.119 | 123 | 0.146 | 121 | 0.074 | 114 | 0.079 |
 There is no particular reason to exclude this or any other site, but this
thought experiment indicates that processes specific to one site may shape
the overall pattern observed when nests are pooled across sites. A superior
approach would be to monitor a large number of sites in each category and
treat the site as the sampling unit, but logistical constraints prohibited
this. In order to understand with confidence the effects of timber extraction
on the breeding success of forest birds, it will be necessary to undertake
long-term and broad-scale monitoring programs. Nest success should be monitored
at multiple sites for several years before and many years after a timber
harvest. The patterns observed may be specific to the species and landscapes
studied. For this reason, it is desirable to adopt a mechanistic approach;
i.e. to understand why and not simply whether edge effects occur (Winslow,
1999).
There is no particular reason to exclude this or any other site, but this
thought experiment indicates that processes specific to one site may shape
the overall pattern observed when nests are pooled across sites. A superior
approach would be to monitor a large number of sites in each category and
treat the site as the sampling unit, but logistical constraints prohibited
this. In order to understand with confidence the effects of timber extraction
on the breeding success of forest birds, it will be necessary to undertake
long-term and broad-scale monitoring programs. Nest success should be monitored
at multiple sites for several years before and many years after a timber
harvest. The patterns observed may be specific to the species and landscapes
studied. For this reason, it is desirable to adopt a mechanistic approach;
i.e. to understand why and not simply whether edge effects occur (Winslow,
1999).
CONCLUSIONS AND RECOMMENDATIONS FOR MANAGEMENT
There is significant variation in nesting success both spatially and temporally (within and among breeding seasons). In this study I found that year (before or after treatment) and condition (treatment or control) interacted to influence survival and parasitism of Acadian Flycatcher nests, but it is not clear whether these patterns resulted from the timber extraction or from other sources of variation that differed between the sets of sites assigned to each condition. Public forest managers should limit logging where productivity of forest interior migrant birds is a priority until we better understand the factors influencing spatio-temporal variation in nesting success.
It should be noted that several species of migrant birds whose populations are declining use regenerating forest for nesting and may benefit from the canopy disturbance that results from timber extraction. It is important to study how logging affects the abundance and breeding success of these species.